Summary
Keywords
Full Transcript
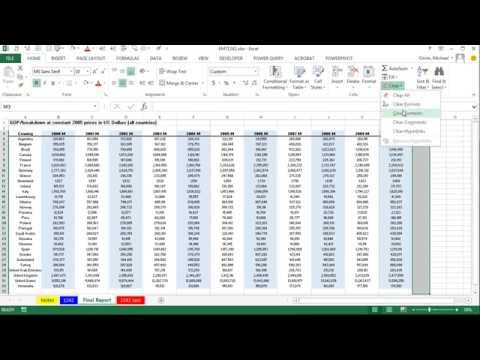
Download Start Excel File: https://excelisfun.net/files/EMT1441-1442Start.xlsx Download Finished Excel File: https://excelisfun.net/files/EMT1441-1442Finished.xlsx Learn how to Take Large Data Set with Country Economic Data for the years 1970 to 2013 and filter, delete and match just the data we want to create a smaller data set using Text To Columns, MATCH function, TRIM function, Filter, Formatting and Page Setup: 1. (00:08) Discuss our task of taking a lot of data, removing only what we want, and then formatting and doing page setup on final report 2. (01:06) Text To Columns to get county names for our report 3. (01:54) TRIM function to remove extra spaces 4. (02:23) Copy Paste Special Values AND Transpose 5. (03:06) MATCH & ISNUMBER functions to create helper column to match countries we need in our final report 6. (04:07) Filter to get Counties and GDP numbers 7. (04:44) Delete Year Columns we do not need. 8. (05:02)Highlight Filtered Table to get Visible Cells Only and paste records to new sheet 9. (05:21) Delete non-adjacent columns in report that are not need in final report 10. (05:33) Display Numbers in Millions using Custom Number formatting: #,##0,, 11. (06:10) Display Years with an M to indicate numbers are shown in millions using Custom Number formatting: 0” M” 12. (06:43) Making sure that we have title that indicates the monetary unit: Constant 2005 US Dollars 13. (07:05) Apply Table Design Principles 14. (07:05) Add Border below Field Names 15. (07:17) Alternate shading for columns with white and light blue to help the visual ease of reading report 16. (08:25) Make sure that text is aligned left and numbers are aligned right 17. (08:39) Page Set Up so report prints correctly Mr Excel & excelisfun Trick 174: Clean & Transform GDP Data Set: Advanced Filter? Or Power Query? Excel Magic Trick 1243: Transform GDP Data Set: Power Query 2nd Method or Advanced Filter? Basic Excel Business Analytics Transforming Data

Continue this lesson in the app
Install CourseHive on Android or iOS to keep learning while you move.


