Summary
Keywords
Full Transcript
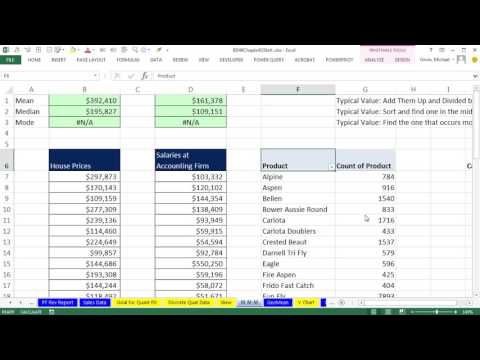
Download files: https://people.highline.edu/mgirvin/AllClasses/348/348/AllFilesBI348Analytics.htm Review the reasons why have three average calculations: 1) (00:11) Mean, Median, Mode = Average = One number that represents all the data points = A measure of central tendency. 2) (00:40) Mean to get a typical value. Add them up, Divide by the count. Use AVERAGE function. 3) (01:26) Median to get a typical value. The middle value in a sorted list. Median is the calculations to make if there are extreme values. Use MEDIAN Function. 4) (03:01) Mode to get a typical value for quantitative or categorical data. Finds the item that occurs most frequently. MODE.SNGL is for number data (quantitative data) and will find the mode when there is a single mode. 5) (04:18) If distribution is symmetrical Mean = Median = Mode. 6) (04:31) PivotTable and Sort feature to find the Mode for Categorical Data. 7) (06:29) MODE.MULT Array Function for number data (quantitative data) when there are multiple modes. This is an Array Function that requires the special key stroke: Ctrl + Shift + Enter. See Two Examples. Download Excel File Not: After clicking on link, Use Ctrl + F (Find) and search for “Highline BI 348 Class” or for the file name as seen at the beginning of the video.

Continue this lesson in the app
Install CourseHive on Android or iOS to keep learning while you move.


