Data visualisation using ggplot with R Programming - Plotly for 3d and interactive plots in R
4.0(0)
4 learners
What you'll learn
This course includes
6.5 hours of video
Certificate of completion
Access on mobile and TV
Summary
Full Transcript
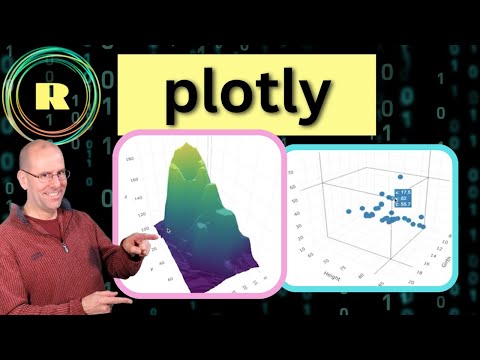
Use plotly to create interactive and 3d plots in R. Plotly integrates with ggplot2. If you're interested in data visualisation and want to create plots and graphs that tell a story with your data then plotly is a great place to start. This video is for anyone interested in R programming.
Continue this lesson in the app
Install CourseHive on Android or iOS to keep learning while you move.