
Summary
Keywords
Full Transcript
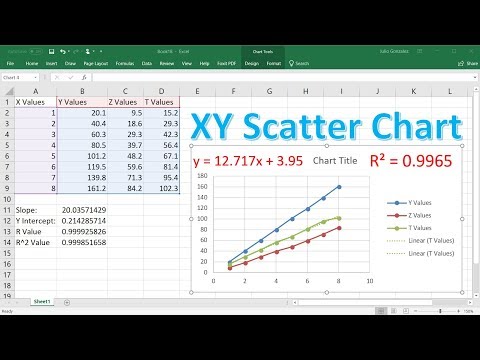
This video tutorial explains how to make a X Y Scatter Chart in excel and how to use to calculate the slope of the straight line equation as well as the y intercept and correlation coefficient or R value. It explains how to do this using the trendline feature of the excel graph and the slope function and intercept function in excel. Excel Tutorial For Beginners: https://www.youtube.com/watch?v=nK-uNYuvcag Top 30 Excel Tips & Shortcuts: https://www.youtube.com/watch?v=UMad9_-4rOU Final Exam and Test Prep Videos: https://bit.ly/41WNmI9 _________________________________________ Excel - Statistics - Mean, Median, Mode: https://www.youtube.com/watch?v=aRR86imVsxM Excel Scatter Charts: https://www.youtube.com/watch?v=hwqq0HYrers Excel - Finding Slope & Y-Intercept: https://www.youtube.com/watch?v=KwQsV77bYDY Solving Polynomial Equations - Goal Seek: https://www.youtube.com/watch?v=lomAl6XB_SM __________________________________________ How To Calculate Loan Payments In Excel: https://www.youtube.com/watch?v=ifbNN2SoKlk How To Create an Amortization Table: https://www.youtube.com/watch?v=QZfMW203v4U How To Look Up Customer Data In Excel: https://www.youtube.com/watch?v=HDda6ny40ZM How To Create a Data Entry Form In Excel: https://www.youtube.com/watch?v=_tZLGBgQCYo _________________________________________ YouTube Channel Growth Accelerator: https://www.patreon.com/YouTubeChannelGrowthAccelerator Algebra For Beginners: https://www.video-tutor.net/algebra-for-beginners-basic-introduction.html Final Exams and Video Playlists: https://www.video-tutor.net/ Full-Length Math & Science Videos: https://www.patreon.com/mathsciencetutor/collections

Continue this lesson in the app
Install CourseHive on Android or iOS to keep learning while you move.




