Summary
Keywords
Full Transcript
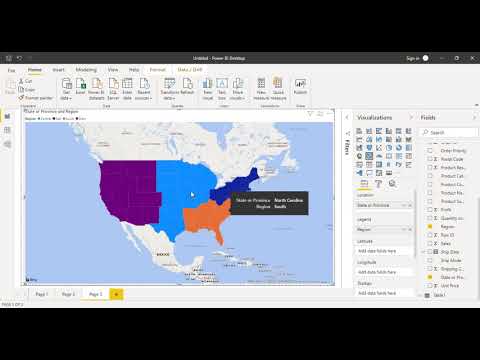
In this Power BI video, we will see the creation of a Filled Map in Power BI. Then we will compare the way information is presented in the simple map and a filled map, also we will see how to categorize the categorized data in Power BI. Apart from this, we will also see that which parameter is more efficient in categorizing the data in a Power BI map. Download Link of the sample data set : https://www.superdatascience.com/pages/powerbi This is a Power BI introductory tutorial video. In this we will be seeing what is Power BI software? What are the features of Power BI? We will also take a look at Power Bi components and try to compare the recent market trends on the popularity of Power BI and Tableau to compare its popularity. Power Bi is a business intelligence tool that helps to visualize the data in the form of reports and dashboard. #PowerBI #Microsoft #DataVisualization #visualization #BusinessIntelligence #BI #PowerBIDesktop #PowerBIService #PowerBIMobileApp #PowerBIReportServer #Excel #Windows10

Continue this lesson in the app
Install CourseHive on Android or iOS to keep learning while you move.


