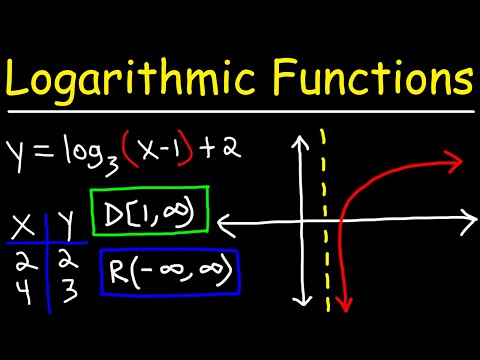
This algebra video tutorial explains how to graph logarithmic functions using transformations and a data table. It explains how to identify the vertical asymptote as well as the domain and range of the logarithmic function in interval notation.
Domain and Range - Free Formula Sheet:
https://www.video-tutor.net/precalculus-formula-sheets.html
Logarithms - Free Formula Sheet:
https://www.video-tutor.net/algebra-formula-sheet.html
Logarithms - More Video Lessons:
https://www.video-tutor.net/logarithms.html
Algebra Final Exam Review:
https://www.youtube.com/watch?v=U0Y8nSmEpNM
Final Exam and Test Prep Videos:
https://bit.ly/41WNmI9
Continue this lesson in the app
Install CourseHive on Android or iOS to keep learning while you move.