Summary
Full Transcript
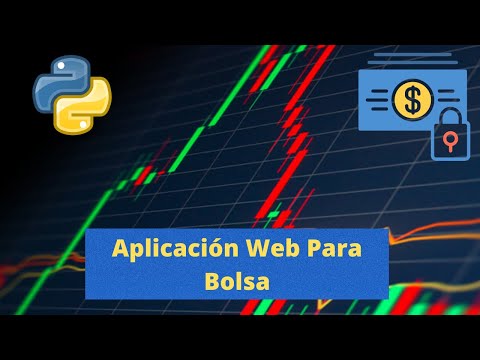
Aprende a creación WEB Interactivas para realizar seguimiento de tus inversiones usando Python y Streamlit. Te enseñaré como puedes crear gráficos de vela de forma sencilla. 👉CURSO Creación de Robots de Trading con Python► https://www.udemy.com/course/aprende-a-crear-robots-de-inversion-con-python/?referralCode=F5539EA80C220168C485 👉CURSO Machine Learning con Python para Trading► https://www.udemy.com/course/machine-learning-con-python-para-trading/?referralCode=E2F503FB9F2149EF9300 👉CURSO Python para Finanzas► https://www.udemy.com/course/python-para-finanzas/?referralCode=22C4EFC3C649E8B9A10E 👉CURSO Creación de robots de Inversión para Criptomonedas► https://www.udemy.com/course/bot-de-inversion-para-criptomonedas-con-python/?referralCode=1FC5A162457C990F6549 👉Únete a nuestra Comunidad en Telegram► https://t.me/cienciadedatos

Continue this lesson in the app
Install CourseHive on Android or iOS to keep learning while you move.


